27.04.2022 – Now prices are again in line with the situation: the stock markets have corrected sharply. And thus the current negative factors have been priced in again. The S&P 500 is now at three interesting technical milestones. According to an investment house, there is one chart signal in particular, after which the SPX has previously always corrected by around 20 percent.
On the Nasdaq, things just got really rough, with Tesla’s crash dragging the index down in its worst day since September 2020. In fact, high-tech prices hit the intermediate lows of the Ukraine invasion. So all the bears were right, talking about an interim bear market rally that was fundamentally unjustified. In contrast, the greenback – fueled by the Federal Reserve’s rate hike rhetoric – has reached its highest level since May 2020 as measured by the dollar index.
Shoulder-to-shoulder?
Things are really interesting in the S&P 500, though. We see that the index has now actually formed a somewhat squeezed shoulder-head-shoulder formation in the weekly chart. Perhaps you also recognize this – although this is of course always a matter of interpretation. In any case, a crash below the neckline, which is currently reached exactly at around 4,200 points, threatens.
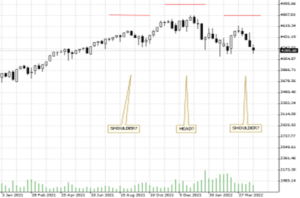
Source: Bernstein Bank GmbH
But that is not all. Graham Summers, analyst at Phoenix Capital Research recently sounded the alarm: “The technical damage of the last few weeks has been severe. As I write this, the S&P 500 is hovering around its 50-week/10-month moving average. If it breaks lower here… it’s going to at least 4,200 if not 3,600.” The monthly MACD has also sent out a sell signal that has been fatal in the past: “This has preceded declines of 20+% every time it registered in the last four years. Put simply, another bloodbath is coming… and smart investors are already taking steps to profit from it.”
The world is back on track
With this, the stock market has more or less returned to normal – and it is thus at an important crossroads. The bull market since mid-March has also been amazing given the Corona damage to the economy, the Ukraine crisis, supply chain disruptions, rising inflation and a hawkish Fed. But why had prices risen in the first place?
The cleanest of the dirty shirts
Phoenix Capital Research, provided the answer: according to the report, investors had been pulling money out of U.S. bonds in a big way and putting it into stocks. The reason for this was the fact that bond prices always fall in inflation and yields rise. In March, investors pulled $40 billion out of bonds and pumped $45 billion into stocks, according to the report. Of that, $41 billion closed in U.S. equity funds alone, he said. Because the USA is still the cleanest of all dirty shirts: “Because the U.S. is the “cleanest dirty shirt”. (…) It’s not that stocks are a great investment at current prices… it’s that bonds are so much worse.”
Acute crash danger
Our conclusion: According to this picture, the SPX is more or less like an exhausted hiker standing at the precipice in a dirty T-shirt. One little push and it crashes into the canyon. The reasons that suggest themselves for the collapse would be the resurgence of the Corona crisis in China or an escalation in the Ukraine war. Even though the above chart signals are more interesting for long-term investors, traders should also take it to heart. Because if the warnings are true, we will soon see violent price movements. Mostly downwards, with counter-reactions upwards. A real vola party. The Bernstein Bank wishes successful trades and investments!
Important Notes on This Publication:
The content of this publication is for general information purposes only. In this context, it is neither an individual investment recommendation or advice nor an offer to purchase or sell securities or other financial products. The content in question and all the information contained therein do not in any way replace individual investor- or investment-oriented advice. No reliable forecast or indication for the future is possible with respect to any presentation or information on the present or past performance of the relevant underlying assets. All information and data presented in this publication are based on reliable sources. However, Bernstein Bank does not guarantee that the information and data contained in this publication is up-to-date, correct and complete. Securities traded on the financial markets are subject to price fluctuations. A contract for difference (CFD) is also a financial instrument with leverage effect. Against this backdrop, CFD trading involves a high risk up to the point of total loss and may not be suitable for all investors. Therefore, make sure that you have fully understood all the correlating risks. If necessary, ask for independent advice. CFDs are complex instruments and are associated with the high risk of losing money quickly because of the leverage effect. 68% of retail investor accounts lose money trading CFD with this provider. You should consider whether you understand how CFD work and whether you can afford to take the high risk of losing your money.7