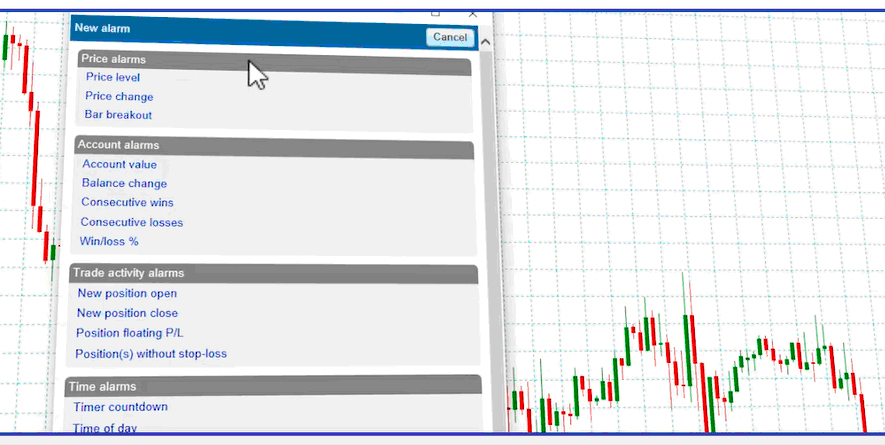
The Alarm Manager is a unique and powerful trade assistant. Traders can create rule-based alarms which trigger any number of actions. The software can notify the trader about events, carry out trading actions such as placing new orders or closing existing positions, or send updates to followers via email, SMS, or Twitter. The available alarms include the following key areas:
- Account alarms: changes in key account parameters, e.g. margin, balance, profit, loss, equity, consecutive wins/losses etc
- News/Sentiment alarms: triggered by calendar events or by material changes in live market sentiment
- Trade activity alarms: notifies about newly opened or closed trades, floating P&L on individual trades, and identifies trades without stop losses etc
- Price alarms: triggered by changes/levels/breakouts in price
- Technical Indicator alarms: based on changes in technical indicators such as ATR, Bollinger Bands, Moving Averages , MACD, Swings, Stochastics, RSI, etc
- Time alarms: allows the trader to set stop-watch and time-of-day alarms
Correlation Matrix
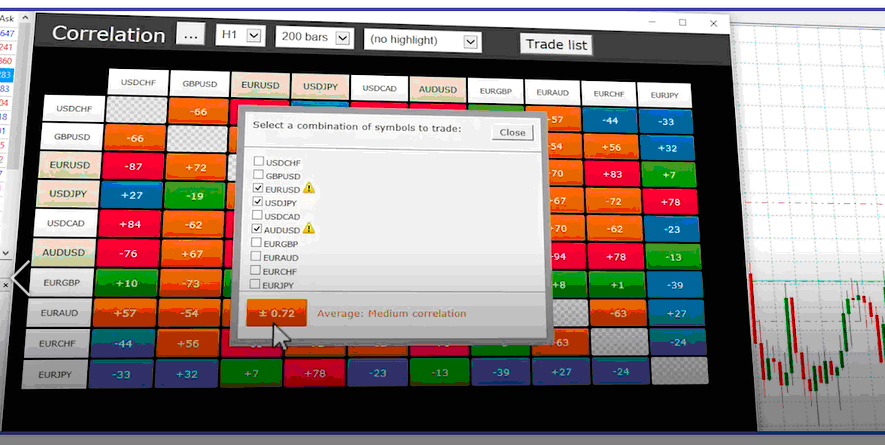
The Correlation Matrix helps traders to manage risk and trade with greater confidence. The app shows a grid of the correlations between pairs of trading symbols. It is an overview of all the options available to a trader. The Correlation Matrix will handle any symbols which are available in the underlying trading platform, allowing a calculation of the correlation for example of metals and equities against forex. For detailed inspection of the correlation between any two instruments, traders can drill down using the Correlation Trader app.
The trader can change the basis of the calculation, selecting a timeframe such as M15 and a number of historic bars, based on the most appropriate time period for the length of trade which they are expecting.
- Highlighting strong or weak correlation: The app lets the trader highlight sub-sections of the grid, e.g. isolating symbols which are strongly or weakly correlated against each other.
- “What if?” scenarios: The app can calculate an average correlation between all the symbols in which the trader currently has an open position. The app also lets the trader select any basket of symbols and then calculates the average of the current correlations between them. This enables the trader to assess the internal risk of a prospective portfolio of trades which they are currently considering.
Correlation Trader
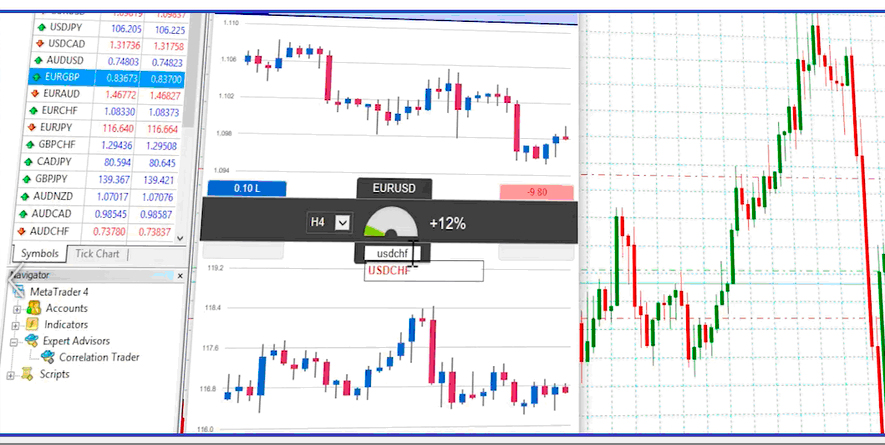
The Correlation Trader takes the valuable information in the Correlation Matrix and extends it so that traders can trade real-time differences in correlation between two markets of their choice. The Correlation Trader shows not only the current correlation between the two chosen symbols, but also the recent price activity helping the trader to make better informed decisions. Traders can use the Correlation Trader app for two main purposes:
- To inspect historic correlation between symbols in more detail
- To watch for, and trade, emerging differences in that correlation
The trader can choose any timeframe for the historic charts – including periods such as M3 or H8 which are not always supported by the underlying platform – and they can then use their judgement, in combination with the current correlation, to watch for tradeable differences in the relationship between symbols. For example, if the correlation figures show a strong relationship between EUR/USD and USD/JPY over recent trading, but the latest price movements suggest a break-down in the relationship, then that could constitute a trading opportunity.
The Correlation Trader includes a simple deal ticket for placing orders directly from the app, without needing to go back to the underlying platform.
The app can also be used just as a simple way of displaying two price charts next to each other, along with the current open position and profit for each symbol.
Excel RTD
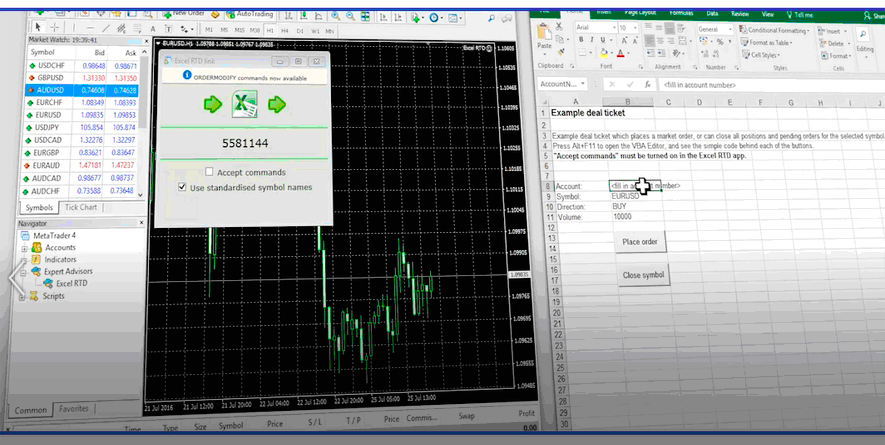
The Excel RTD app is a very adaptable trade monitoring, analysis and reporting tool which allows traders to interact with trading platforms using their Excel skills rather than having to learn complex programming languages. The app enables traders to do two distinct things:
- Put real-time account, ticket, and price data into Excel using only Excel’s built-in RTD() function. No macros, no programming. Only standard Excel knowledge is required.
- Send simple trading commands from VBA code in Excel (or from any other language which supports COM).
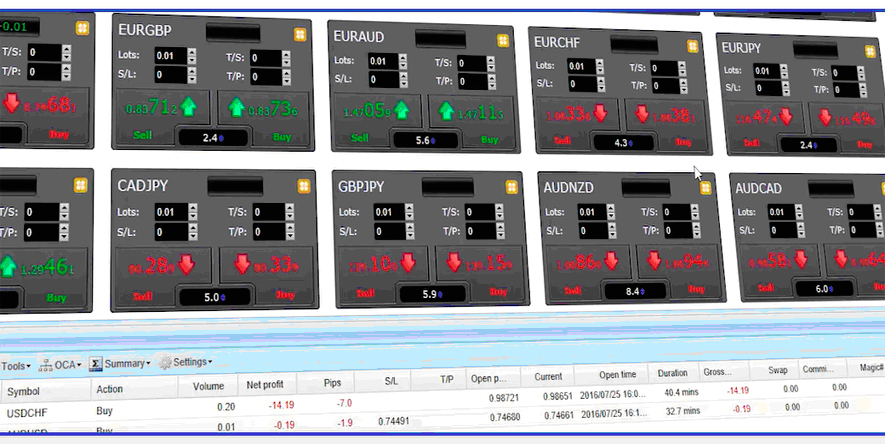
Market Manager
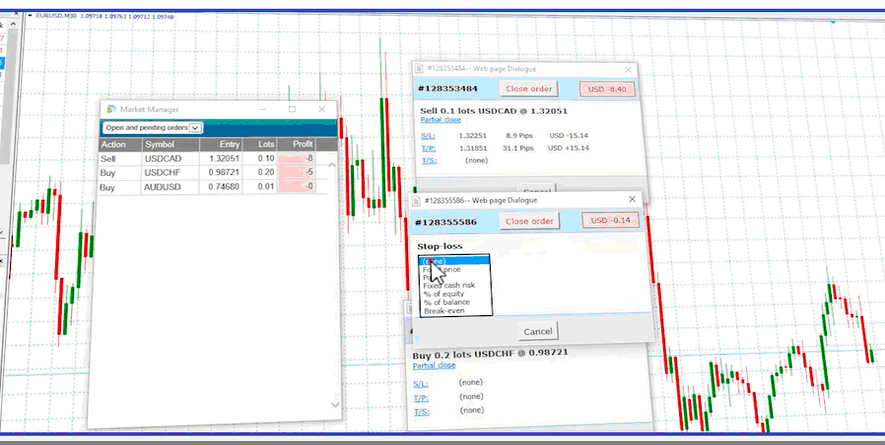
The Market Manager provides full control over an account, and important market information, from one small and convenient window. The app provides the following key functionality:
- Symbol prices
- Current open position and profitability for each symbol
- Quickly switch between different groups of symbols
- Ability to place new market and pending orders
- List of open tickets
- Ability to modify existing positions and pending orders, e.g. change the s/l
- Account metrics such as equity and free margin, with gauges showing profit and margin usage in graphical terms
- Overview of recent price movements on a symbol over multiple timeframes
Mini Terminal
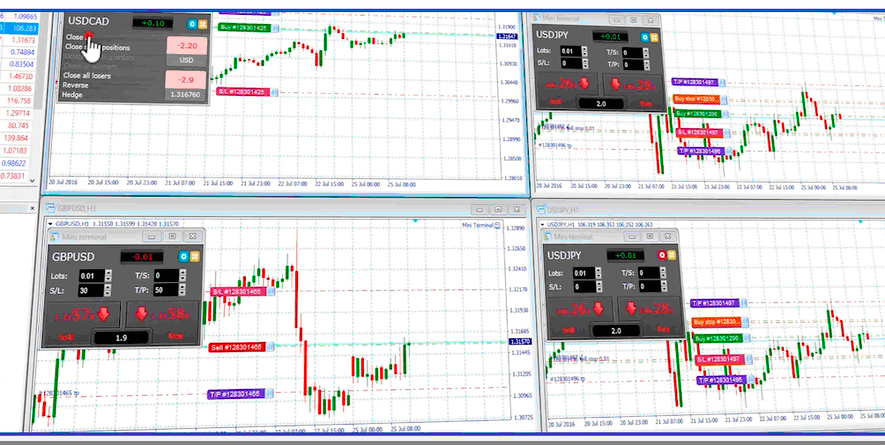
The Mini Terminal is an extension of the Trade Terminal, designed for traders who want to concentrate on a specific market and which displays the same deal ticket as the Trade Terminal in the context of a specific trading chart. Its deal ticket has the following key features:
- Simple fields for setting s/l, t/p and trailing stop in pips
- Pop-up calculators, e.g. for working out the lot size which corresponds to a cash risk given a particular s/l distance
- Open-position marker
- Pop-up dealing form for creating pending orders as well as market orders
- Ability to create templates for quick order entry
- Quick links for closing all positions, or all winning/losing positions
- Quick links for reversing or hedging a position
In other words, the Mini Terminal allows one-click entry for simple market orders, and two-click entry for potentially-complex pre-defined templates. These templates can also be used in the Trade Terminal and Market Manager apps.
Sentiment Trader
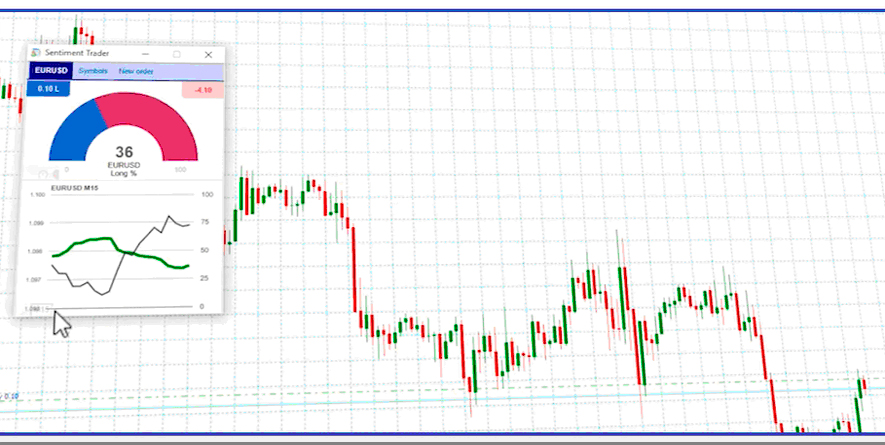
The Sentiment Trader is based on live sentiment data from www.fxblue.com (part of the FX Blue group), and enables traders to take real-time market sentiment into account in their trading decisions. Key features include:
- Current long/short sentiment for an instrument such as EUR/USD
- A dashboard of current sentiment for multiple symbols
- A chart of historic sentiment plotted against price
Traders can use the sentiment information as confirmation of trading decisions, or as fail-safe (e.g. don’t take a short trade if sentiment is above 80%). Some traders also attempt to identify patterns in the sentiment and subsequent price movements, and make trading decisions based purely on the sentiment alone. Further options in the Sentiment Trader app include the following:
- Choice of timeframes for historic sentiment and price, e.g. M1, M5, H1
- Customisable view of current sentiment (gauge, pie chart, dial)
- Customisable view of historic data (candlestick, line etc)
- Dashboard of current open position in each symbol, as well as sentiment
- Simple deal ticket for placing orders directly from the Sentiment Trader, without needing to go back to the underlying platform
Session Map
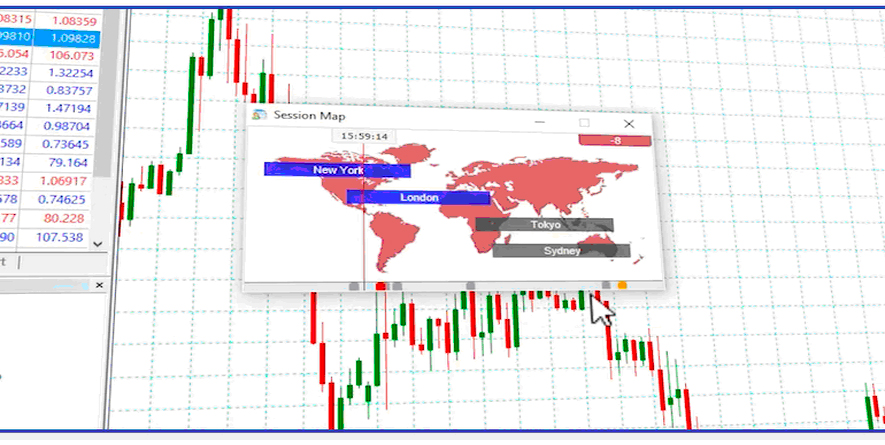
The Session Map gives the trader a quick market overview, including the current status of their account.
- World markets: The app’s main display is a map showing the main world markets and a representation of the trader’s local time (according to their computer clock). However, the Session Map also includes a number of other elegant features.
- Economic calendar: The bar at the bottom of the Session Map shows future events in the economic calendar, colour-coded by probable impact. Traders can get a quick description of each news event by hovering the mouse over the marker in the bar, and they can read the full description by clicking on the marker.
- Key market changes: The Session Map can also display information about price movements in key markets during the current session or a previous one. For each of a list of major symbols, the app displays the following information about what has happened in the session so far (or at the end of a completed session):
- Rise or fall during the session, in pips
- Total trading range during the session, in pips
- Closing price – or current price for an in-progress session
- Account data: As a further refinement, the Session Map also shows the status of the trader’s account. The world map is colour-coded depending on whether the trader is in profit or loss, and any floating P/L is shown in a marker at the top of the map. Clicking on this marker displays key account metrics: equity, balance, margin usage.
Stealth Orders
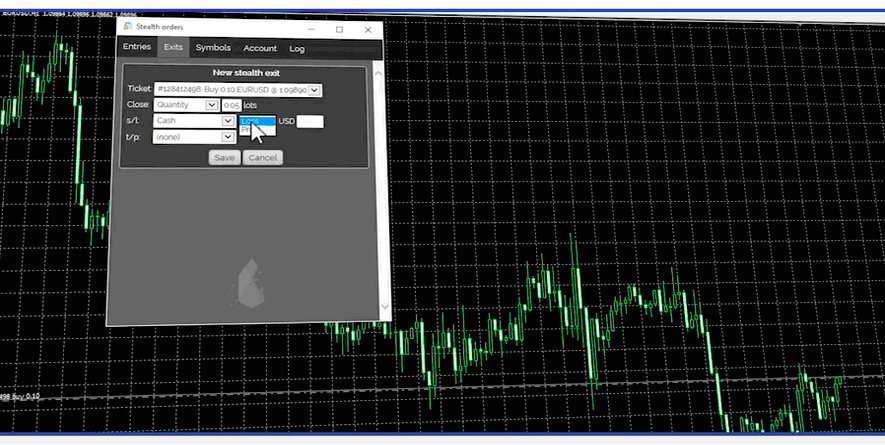
The Stealth Orders app lets traders hide their pending orders from other market participants. Instead of placing a stop or limit order, the app waits for an entry price to be hit and then buys or sells at market. The app also provides stealth stop-losses and take-profits, closing out positions by trading at market when an exit price – or a cash profit/loss – is reached.
- The Stealth Orders app provides four groups of features:
- Stealth entries: the equivalent of limit and stop orders. Traders can also create one-cancels-all (OCA) groups of orders where the remaining orders are removed when the first one is filled.
- Stealth exits: the equivalent of a take-profit or stop-loss on a single trade. Traders can define multiple exits for the same ticket, scaling out of a position when different thresholds are reached.
- Symbol exits: these close all the positions and orders for a symbol if a price is hit, or if the combined profit of the positions reaches a threshold. Traders can also use filtering, e.g. “only long EUR/USD orders, and only if their comment includes the text Breakout”.
- Account exits: these close all positions and orders on the entire account when a threshold is hit.
Tick Chart Trader
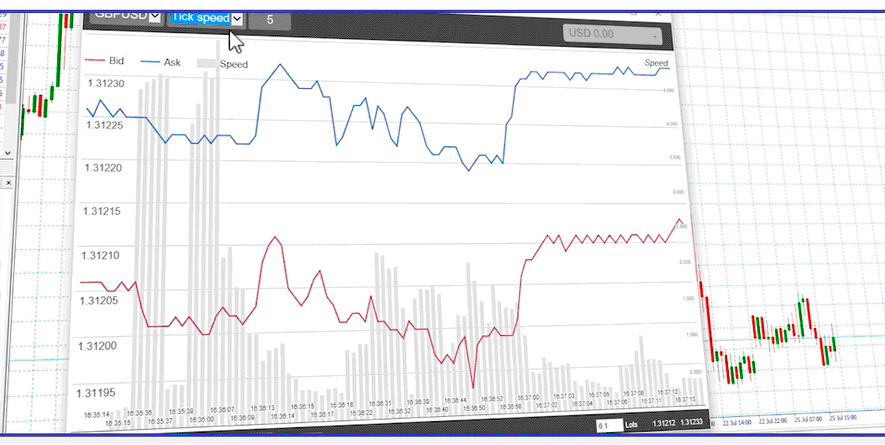
The Tick Chart Trader app displays a variety of types of tick chart, with ultra-fast order entry and exit via single mouse-clicks or keyboard shortcuts. It is ideal for traders who want to place very short term trades, entering and exiting the market rapidly several times in the course of a trading session. The app provides five different tick-chart views for different styles of trader:
- Simple tick chart which updates every time the ask or bid price changes
- Tick chart plus tick speed: shows bars indicating how long the last N ticks have taken to form, indicating market activity
- Timed: the chart updates on every tick, but the X-axis is time-based and thus indicates the difference between busy and quiet periods
- Candles: the app displays OHLC candles, but based on a number of ticks rather than a time period (e.g. 20-tick bars)
- Versus: shows the changing movements of two markets against each other
Market orders can be placed either by clicking on the ask or bid price, or by using the keyboard shortcuts B and S. For ultra-fast order entry, the trader can choose to allow the Ctrl key to place orders without confirmation. Ctrl+click or a keyboard shortcut such as Ctrl+B then places an order instantly, without any confirmation or user interface pop-up.
Trade Terminal
The Trade Terminal is a feature-rich professional trade execution and analysis tool. It is designed to provide a number of trading features which are not typically present in the underlying trading platforms.
Its deal ticket has the following key features:
- Simple fields for setting stop-loss, take-profit and trailing stop in pips
- Pop-up calculators, e.g. for working out the lot size which corresponds to a cash risk given a particular s/l distance
- Open-position marker, providing access to options for quickly closing, reversing, or hedging the position in a symbol
- Pop-up dealing form for creating pending orders as well as market orders
- Ability to create templates for quick order entry
- Displays key symbol information (pip size, value per pip etc)